Working with OpenRefine
Overview
Teaching: 20 min
Exercises: 10 minQuestions
How can we bring our data into OpenRefine?
How can we summarize our data with facets?
How can we find and correct errors in our raw data with clustering?
How can we separate values into multiple columns?
Objectives
Create a new OpenRefine project from a CSV file.
Understand potential problems with file headers.
Use facets to summarize data from a column.
Use clustering to detect possible typing errors.
Understand that there are different clustering algorithms which might give different results.
Employ drop-downs to make batch edits.
Manipulate data using previous steps with undo/redo.
Lesson
Workshop dataset
Quick note on the data we’ll be using in this workshop. It is from a fictional excavation that will take place in the Digital Archaeology Lab later this year. The data have been intentionally ‘messed up’ for the lesson.
Download the data file to your computer by clicking this link.
Creating a new OpenRefine project
In Windows, you can start the OpenRefine program by double-clicking on the openrefine.exe file. Java services will start automatically on your machine, and OpenRefine will open in your browser. On a Mac, OpenRefine can be launched from your Applications folder. If you are using Linux, you will need to navigate to your OpenRefine directory in the command line and run ./refine.
OpenRefine can import a variety of file types, including tab separated (tsv), comma separated (csv), Excel (xls, xlsx), JSON, XML, RDF as XML, and Google Spreadsheets. See the OpenRefine Importers page for more information.
In this first step, we’ll browse our computer to the sample data file for this lesson. Instructions on downloading the data are available here.
Once OpenRefine is launched in your browser, the left margin has options to Create Project, Open Project, or Import Project. Here we will create a new project:
1. Click Create Project and select Get data from This Computer.
2. Click Choose Files and select the file excavation_data.csv. Click Open or double-click on the filename.
3. Click Next>> under the browse button to upload the data into OpenRefine.
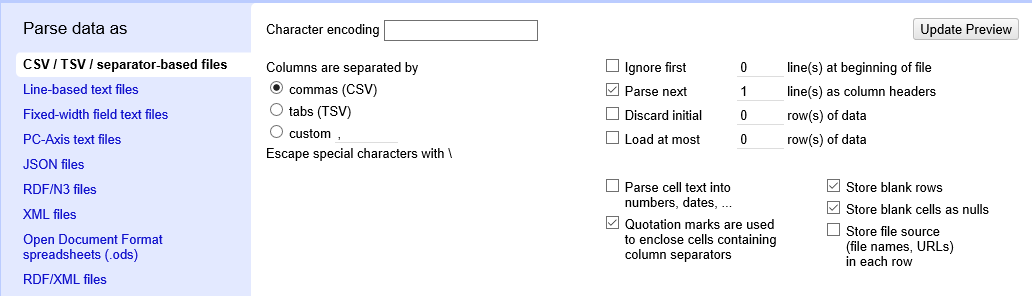
4. OpenRefine gives you a preview - a chance to show you it understood the file. If, for example, your file was really tab-delimited, the preview might look strange. You would then choose the correct separator in the box shown and click Update Preview (bottom left). If this is the wrong file, click <<Start Over (upper left). There are also options to indicate whether the dataset has column headers included and whether OpenRefine should skip a number of rows before reading the data.
5. If all looks well, click Create Project>> (upper right).
Note that at step 1, you could upload data in a standard form from a web address by selecting Get data from Web Addresses (URLs). However, this won’t work for all URLs.
Rows vs Records
OpenRefine has two modes of viewing data: ‘Rows’ and ‘Records’. At the moment we are in Rows mode, where each row represents a single record in the data set. In Records mode, OpenRefine can link together multiple rows as belonging to the same Record.
Using Facets
Exploring data by applying multiple filters
Facets are one of the most useful features in OpenRefine and can help both get an overview of the data in a project as well as helping you bring more consistency to the data. OpenRefine supports faceted browsing as a mechanism for
- seeing a big picture of your data
- filtering down to just the subset of rows that you want to change in bulk.
A ‘Facet’ groups all the like values that appear in a column, and then allow you to filter the data by these values and edit values across many records at the same time.
One type of Facet is called a ‘Text facet’. This groups all the identical text values in a column and lists each value with the number of records it appears in. The facet information always appears in the left hand panel in the OpenRefine interface.
Here we will use faceting to look for potential errors in data entry in the material column.
- Scroll over to the
materialcolumn. - Click the down arrow and choose
Facet>Text facet. - In the left panel, you’ll now see a box containing every unique value in the
materialcolumn along with a number representing how many times that value occurs in the column. - Try sorting this facet by name and by count. Do you notice any problems with the data? What are they?
- Hover the mouse over one of the names in the
Facetlist. You should see that you have aneditfunction available. - You could use this to fix an error immediately, and OpenRefine will ask whether you want to make the same correction to every value it finds like that one. But OpenRefine offers even better ways to find and fix these errors, which we’ll use instead. We’ll learn about these when we talk about clustering.
Using clustering to detect possible typing errors
In OpenRefine, clustering means “finding groups of different values that might be alternative representations of the same thing”. For example, the two strings New York and new york are very likely to refer to the same concept and just have capitalization differences. Likewise, Deidre and Deidra probably refer to the same person. Clustering is a very powerful tool for cleaning datasets which contain misspelled or mistyped entries. OpenRefine has several clustering algorithms built in. Experiment with them, and learn more about these algorithms and how they work.
- In the
materialText Facet we created in the step above, click theClusterbutton. - In the resulting pop-up window, you can change the
Methodand theKeying Function. Try different combinations to see what different mergers of values are suggested. - Select the
key collisionmethod andmetaphone3keying function. It should identify two clusters. - Click the
Merge?box beside each cluster, then clickMerge Selected and Reclusterto apply the corrections to the dataset. - Try selecting different
MethodsandKeying Functionsagain, to see what new merges are suggested. - You should find no more clusters are found.
Different clustering algorithms
The technical details of how the different clustering algorithms work can be found at the link below.
Transforming data
The values in the GPS column are GPS points but we’ll need to adapt them before we can import these points into a GIS. We don’t need the square brackets and we need the values to be separated into latitude and longitude fields.
- Click the down arrow at the top of the
GPScolumn. ChooseEdit Cells>Transform... - This will open up a window into which you can type a GREL expression. GREL stands for General Refine Expression Language.
- First we will remove all of the left square brackets (
[). In the Expression box typevalue.replace("[", "")and clickOK.
What the expression means is this: Take the value in each cell in the selected column and replace all of the “[” with “” (i.e. nothing - delete).
- Click
OK. You should see in theGPScolumn that there are no longer any left square brackets. Next do the same for all of the]’s in the column!
Now that we have cleaned out extraneous characters from our GPS column, we can separate the latitude and longitude points into two columns.
- Click the down arrow at the top of the
GPScolumn. ChooseEdit cells>Split multi-valued cells... - Select
by separator, and use the,separator. - Click
OK.
Wait…this isn’t what we wanted!
Using undo and redo
It’s common while exploring and cleaning a dataset to discover after you’ve made a change that you really should have done something else first. OpenRefine provides Undo and Redo operations to make this easy.
- Click where it says
Undo / Redoon the left side of the screen. All the changes you have made so far are listed here. - Click on the step that you want to go back to, in this case go back one step to before you had
Split multi-valued cells in column GPS. - Visually confirm that the rows are back to how we want them.
- Notice that you can still click on the later steps to
Redothe actions.
Spliting a column
Now that we have the GPS column back, let’s split it correctly!
- Click on the down arrow at the top of the
GPScolumn but this time selectEdit columnthenSplit into several columns.... - We still want to separate based on the
,separator. Take note of the “After Splitting” options. - Click
Ok.
That’s more like it! Now we can rename the columns to Latitude and Longitude and be ready to import our finds data into a map!
Bonus: More on Facets
As well as ‘Text facets’ Refine also supports a range of other types of facet. These include:
- Numeric facets
- Timeline facets (for dates)
- Custom facets
- Scatterplot facets
Custom facets are a range of different types of facets. Some of the default custom facets are:
- Word facet - this breaks down text into words and counts the number of records each word appears in
- Duplicates facet - this results in a binary facet of ‘true’ or ‘false’. Rows appear in the ‘true’ facet if the value in the selected column is an exact match for a value in the same column in another row
- Text length facet - creates a numeric facet based on the length (number of characters) of the text in each row for the selected column. This can be useful for spotting incorrect or unusual data in a field where specific lengths are expected (e.g. if the values are expected to be years, any row with a text length more than 4 for that column is likely to be incorrect)
- Facet by blank - a binary facet of ‘true’ or ‘false’. Rows appear in the ‘true’ facet if they have no data present in that column. This is useful when looking for rows missing key data.
Numeric and Scatterplot facets display graphs instead of lists of values. The numeric facet graph includes ‘drag and drop’ controls you can use to set a start and end range to filter the data displayed.
Key Points
OpenRefine can import a variety of file types.
OpenRefine can be used to explore data using filters.
Clustering in OpenRefine can help to identify different values that might mean the same thing.
OpenRefine can transform the values of a column.